AI-Powered Sales Forecasting
Predict future revenue trends using advanced time-series models
Project Overview
This project builds a robust sales forecasting pipeline using both deep learning (LSTM) and statistical models (ARIMA/SARIMA) to predict monthly sales revenue based on historical retail data. The solution visualizes trends, compares model accuracy, and integrates results into an interactive Streamlit dashboard for stakeholder analysis.

Objective & Business Context
Forecasting future sales is critical for resource planning, inventory management, and budgeting. This project uses time-series modeling to:
Predict monthly revenue trends
Visualize sales patterns over time
Support data-driven planning with interpretable outputs
Business Value and Real-World Scope
Sales forecasting is a foundational use case in data-driven strategy:
Retail Sector: Demand forecasting and promotion planning
Supply Chain: Smarter inventory and distribution models
Finance: Monthly revenue predictions, budgeting, and capital planning
Executive Planning: Better stakeholder communication and investment forecasting
Implementation Flow
Raw Dataset: Superstore.csv (original retail transaction data)
Processed Datasets:
cleaned_Superstore.csv (cleaned and resampled for monthly sales)
processed_superstore.csv (used in dashboard visualizations)
forecast_results.csv (12-month forecast using ARIMA)
Timeframe: Daily data resampled to monthly aggregates
Target Variable: Sales
Dataset Overview
Data Preprocessing Workflow
Data Preparation:
Parsed Order Date as datetime, sorted chronologically
Resampled to monthly revenue (Sales) totals
Exported cleaned dataset to cleaned_Superstore.csv
Normalized sales values using MinMaxScaler
Generated sequences of 12-month windows for LSTM input
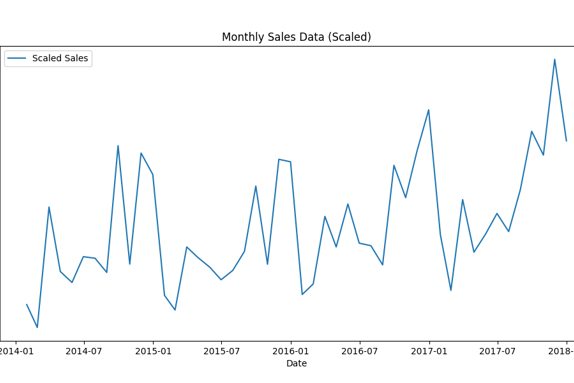
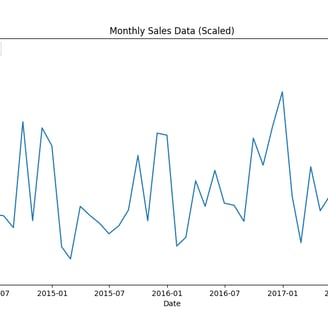
Scaling for Deep Learning
Visual Analytics & Interpretations
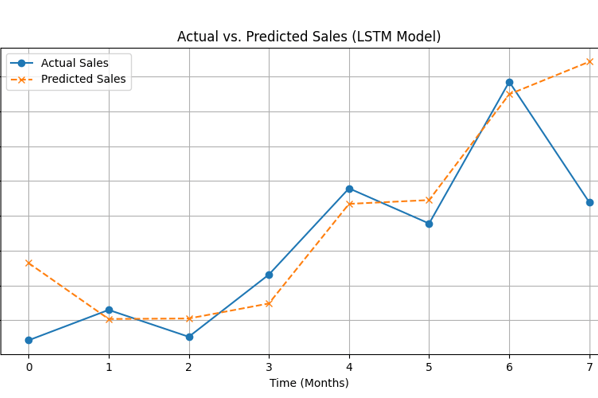
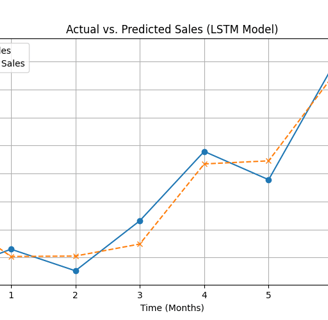
LSTM Forecast vs. Actual Plot: Overlaid comparison to assess model performance
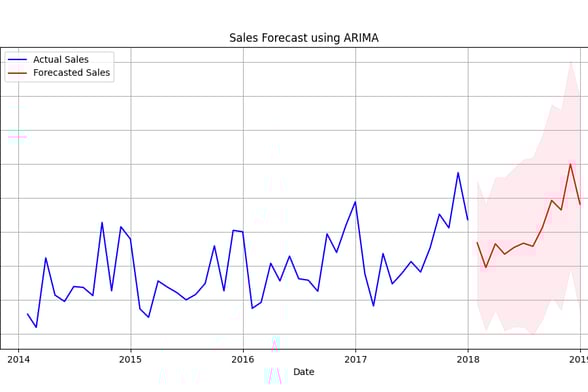
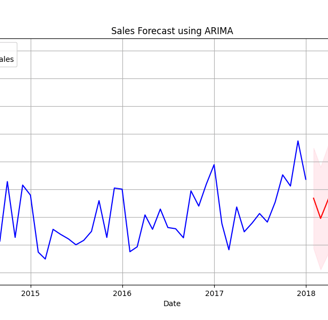
ARIMA Forecast Chart: Includes 12-month future trend + confidence bounds
Monthly Sales Trends: Raw and normalized trend visualizations
Interactive Dashboards: Empower end-users to explore trends and forecasts
LSTM Model Training
2-layer LSTM with dropout → dense output layer
Trained for 100 epochs with validation split
Predictions inverse-scaled for interpretability
LSTM Model Training
Evaluation & Comparison
Streamlit Dashboard
auto_arima used to auto-tune best SARIMA hyperparameters
Model trained on entire dataset, forecasted next 12 months
Confidence intervals computed for visualization
Metrics: MAE and RMSE for both models
Side-by-side plots for predicted vs. actual sales
Metric cards, historical/forecast plots (Plotly), CSV export
Designed for intuitive review by non-technical users
✅ salesforecasting.py: Combined ML/statistical implementation
✅ processed_superstore.csv, forecast_results.csv: Cleaned & forecasted outputs
✅ Charts: Actual vs. predicted plots, confidence intervals
✅ Streamlit App: Dashboard with download and visual insights
Key Deliverables
Tools and Libraries Used
pandas - Data transformation, aggregation
matplotlib/seaborn - Visualize trends and accuracy
tensorflow.keras - LSTM deep learning model
pmdarima/statsmodels - Time-series forecasting
scikit-learn - Scaling + metrics
streamlit/plotly - Dashboard UI and charts
Model Depth: Introduce ensemble models or hybrid models (e.g., LSTM + XGBoost)
Business Dimensions: Include product-level or regional forecasting granularity
Automation: Schedule automated retraining and deployment with new data
Interactivity: Add filtering in dashboard for user-chosen time horizons or segments
Possible Next Steps & Conclusion
Conclusion
This project successfully demonstrates how modern AI techniques can turn historical sales data into actionable revenue forecasts. With both statistical transparency and deep learning’s power, it offers a strong foundation for enterprise forecasting needs — adaptable, interpretable, and production-ready.
Dive into the foundational concepts, algorithms, and real-world relevance behind this project. From machine learning principles to business strategy insights, this conceptual study bridges the gap between technical implementation and applied decision-making—helping you understand not just how it works, but why it matters.
Key Concepts
GitHub Repository
Want to dive deeper into how this project actually works?
We’ve made the complete codebase and resources available for you on GitHub
👉 Access the full repository here:
Whether you're a learner, recruiter, or collaborator — there's something for everyone.
Connect
Join us in shaping the future of leadership.
Innovate
contact@youlead.com
© 2025. All rights reserved.