Predictive Maintenance for Manufacturing
Forecast machine failures with AI to reduce downtime and optimize operations
Project Overview
This project applies machine learning and anomaly detection techniques to anticipate machine failures in a manufacturing setting. By leveraging real sensor data, we identify operational patterns, detect anomalies using Isolation Forest, and predict failures using Random Forest Classifier. The outputs are visualized through interactive dashboards and plots to support real-time maintenance decisions.


Objective & Business Context
Manufacturing systems suffer significantly when machine failures occur unexpectedly — leading to downtime, lost productivity, and costly repairs. Predictive maintenance transforms reactive repair cycles into proactive planning by identifying early warning signals of failure.
This project aims to:
Detect anomalies in machine sensor data
Predict the probability of machine failure using classification models
Analyze contributing features and failure patterns
Visualize failure risks to support maintenance teams
Business Value and Real-World Scope
Predictive Maintenance helps manufacturing firms shift from reactive repairs to data-driven foresight. By identifying early signals of machine stress, businesses can reduce unplanned downtime, optimize maintenance costs, and ensure smoother operations across the factory floor.
Real-World Impact:
Manufacturing: Minimize line stoppages and increase machine uptime
Industrial IoT: Enable smart sensor-based failure alerts
Scalability: Apply the same models across equipment types or plants
This project’s end-to-end pipeline offers a practical blueprint for adopting AI in operational settings — with interpretable results, fast deployment, and tangible ROI.
Implementation Flow
Source: predictive_maintenance.csv
Records: Time-stamped machine sensor data
Key Features:
Temperature, Torque, Tool Wear: Continuous operational parameters
Machine Type: Categorical (converted using Label Encoding)
Failure Modes: Binary flags for TWF, HDF, PWF, OSF, RNF
Target: Machine failure column indicating overall breakdown
Dataset Overview
Data Preprocessing Workflow
Dropped IDs and redundant columns
Encoded Type variable as integers using LabelEncoder
Saved cleaned output as processed_data.csv
Anomaly Detection
Failure Prediction
Visual Exploration
Streamlit Dashboard
Applied IsolationForest on key features
Marked anomalies (outliers) in the dataset
Saved outputs as anomaly_results.csv
Trained a RandomForestClassifier on sensor values
Evaluated using accuracy score and classification report
Saved predictions to predictions_with_rf.csv
Scatter plots for anomaly vs machine parameters
Feature importance bar plots
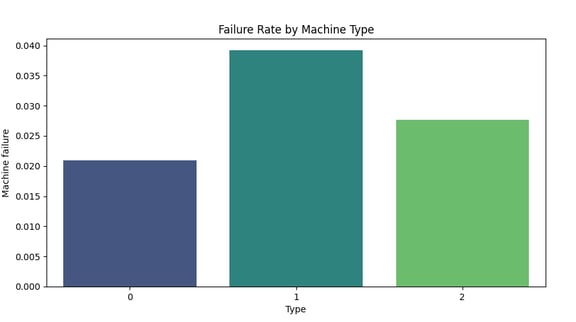
Failure rate by machine type
3D anomaly visualization using plotly
Created dashboard prototype for failure distribution, anomaly plots, and model stats
Data export button for maintenance teams to download results
Visual Analytics & Interpretations
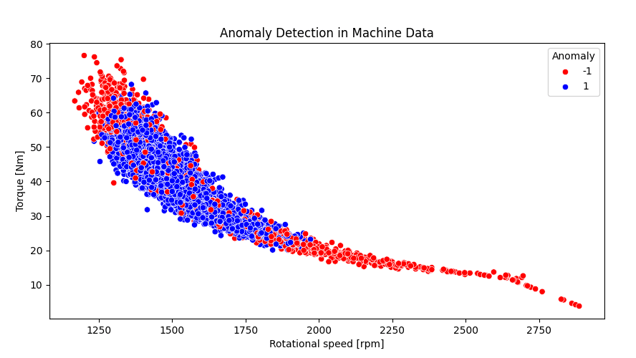
Anomaly Detection Plot: Scatterplot of Torque vs RPM with anomalies highlighted (red = outlier, blue = normal)
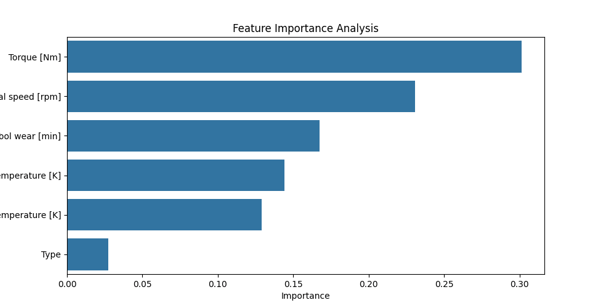
Feature Importance Bar Plot: Importance scores from Random Forest model to interpret which features matter most
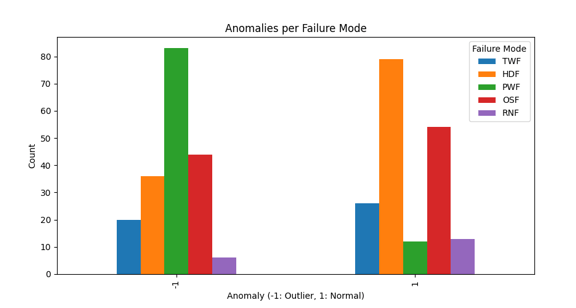
Anomalies per Failure Mode (Grouped Bar Chart): Visualizing how different failure types align with anomalies
Anomaly Detection with Failure Modes (Scatterplot): Overlayed view of Machine Failure + Anomaly status on Torque vs RPM
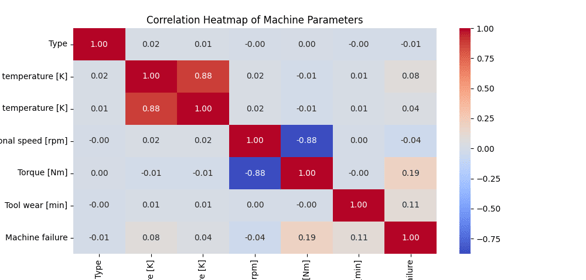
Correlation Heatmap: Shows relationships between sensor variables and the target
Failure Rate by Machine Type (Bar Plot): Identifies which machine types are more failure-prone
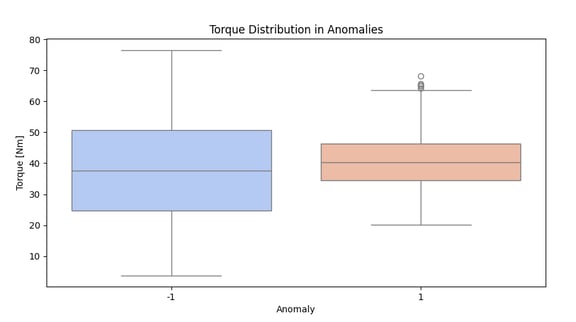
Torque Boxplot by Anomaly Class: Distribution of torque values for anomalous vs normal conditions
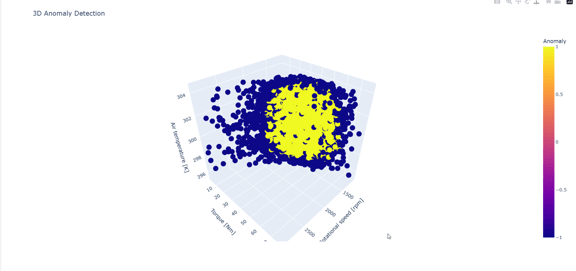
3D Anomaly Detection Plot (Plotly): Interactive 3D visualization across RPM, Torque, and Air Temperature
✅ preprocess.py, train_model.py, predict.py: Core implementation scripts
✅ anomaly_detection.py: Visualization + feature insights
✅ processed_data.csv, predictions_with_rf.csv, anomaly_results.csv: Output datasets
✅ Visuals: All analysis plots (scatter, bar, heatmap, 3D)
✅ Dashboard: Streamlit prototype for internal review
Key Deliverables
Tools and Libraries Used
pandas ,numpy - Data processing and transformation
sklearn - Modeling, scaling, evaluation
matplotlib, seaborn, plotly - Visualization and enhanced styling
joblib - Model persistence
streamlit - Interactive dashboard interface
Model Generalization: Incorporate time series models or neural nets (LSTM)
Edge Deployment: Convert model to run on IoT sensors locally
Failure Mode Classifier: Train model to predict specific failure causes
Interactive UI: Expand dashboard with real-time monitoring & alerting
Possible Next Steps & Conclusion
Conclusion
This project showcases the practical application of AI in industrial reliability and maintenance. By combining supervised and unsupervised models with strong visual storytelling, it not only predicts potential failures but also uncovers operational patterns that may not be evident otherwise. The integration of interpretability-focused dashboards, anomaly overlays, and failure mode breakdowns adds significant value for stakeholders. This is a solid, real-world example of how AI can move from experimentation to impact in manufacturing.
Dive into the foundational concepts, algorithms, and real-world relevance behind this project. From machine learning principles to business strategy insights, this conceptual study bridges the gap between technical implementation and applied decision-making—helping you understand not just how it works, but why it matters.
Key Concepts
GitHub Repository
Want to dive deeper into how this project actually works?
We’ve made the complete codebase and resources available for you on GitHub
👉 Access the full repository here:
Whether you're a learner, recruiter, or collaborator — there's something for everyone.
Connect
Join us in shaping the future of leadership.
Innovate
contact@youlead.com
© 2025. All rights reserved.