AI-Powered Customer Churn Prediction System
Proactively detect and prevent customer churn with machine learning.
Project Overview
This project identifies customers at risk of leaving using historical behavioral and demographic data. Designed for telecom-like industries, the system uses a Random Forest model, SHAP explainability, and trend visualizations to help teams take informed retention actions. The interactive app supports both batch and manual input prediction, enabling real-time insights and strategic customer engagement.


Objective & Business Context
Customer churn is one of the most pressing challenges faced by subscription-driven industries, especially in telecom, internet service providers (ISPs), OTT platforms, and other B2C verticals. Churn directly impacts recurring revenue, customer lifetime value (CLTV), and brand loyalty.
This project aims to predict the likelihood of a customer leaving (churning) using key demographic, service usage, and behavioral data. By integrating AI into this problem space, businesses can proactively identify at-risk users and intervene through personalized retention strategies.
The system is designed to be deployed within real-world business operations, enabling both technical and non-technical users to:
Upload or input customer details
Predict churn probability instantly
Interpret risk drivers using explainable AI (SHAP)
Visualize churn trends for strategic planning
Business Value and Real-World Scope
Industry Applications of Churn Prediction
Telecom & Broadband – Predict service cancellations and proactively offer retention deals before the customer leaves.
SaaS & EdTech – Identify users likely to unsubscribe or abandon the platform and trigger re-engagement campaigns.
Streaming Platforms – Detect early signs of content fatigue and recommend personalized content to improve stickiness.
Banking & Insurance – Forecast customer churn or policy lapses to intervene with personalized incentives or support.
Value Delivered:
Predictive alerts for high-risk customers
Clear metrics for customer health
Easy integration into CRMs and dashboards
Actionable insights for sales and marketing
Explainability using SHAP for trust and compliance
Implementation Flow
This project uses a real-world telco customer churn dataset (churn_data.csv). It includes 7,000+ customer records with the following variables:
Customer Demographics: gender, age, tenure
Service Usage: internet, phone service, streaming
Billing Info: monthly charges, total charges, payment method
Churn Label: Binary indicator (1 = churned, 0 = retained)
This dataset was cleaned, standardized, and used to train a predictive classification model.
Dataset Overview
Technical Workflow
The project pipeline is broken down into the following key stages:
Step 1: Data Preprocessing
Handled missing values (especially Total Charges)
Converted categorical variables using:
Label Encoding for binary categories (e.g., Yes/No)
One-Hot Encoding for multi-category fields (e.g., Internet Service)
Standardized numerical features using StandardScaler
Step 2: Model Training
Built using Random Forest Classifier
Data split: 80% training / 20% testing using train_test_split
Evaluated using:
Accuracy
Precision / Recall
F1-Score
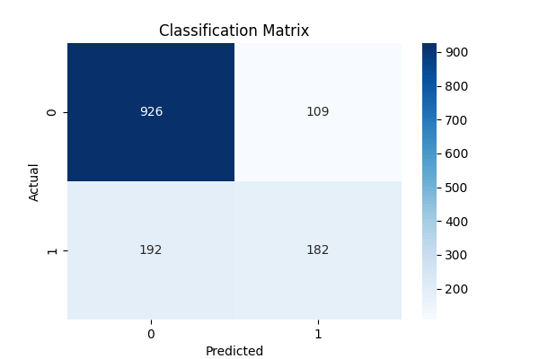
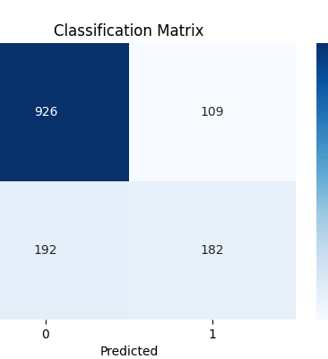
Confusion Matrix
Saved trained model, encoders, scalers using joblib
Step 3: Inference Pipeline
Supports predictions on new customers via:
CSV upload (bulk inference)
Manual entry form (Streamlit)
Applies same preprocessing steps dynamically
Outputs:
Churn risk score
Visual confidence (charts + feature importance)
Step 4: Visualizations & Insights
Generates plots such as:
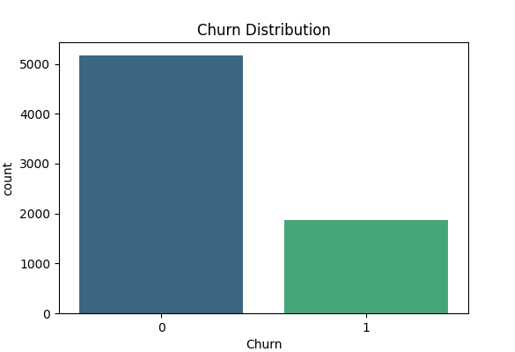
Churn distribution
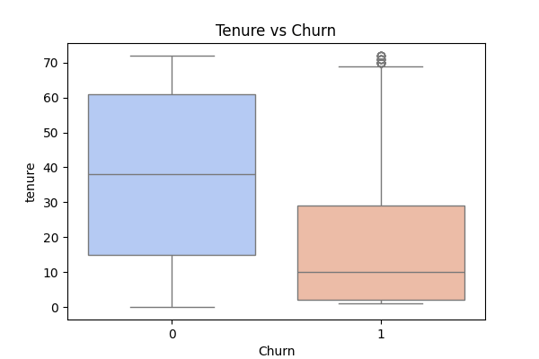
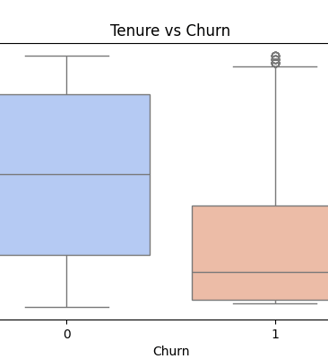
Tenure vs Churn (Boxplot)
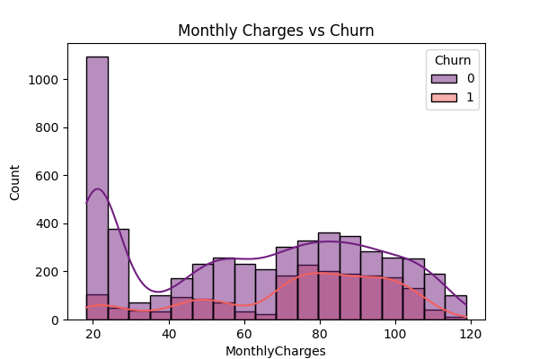
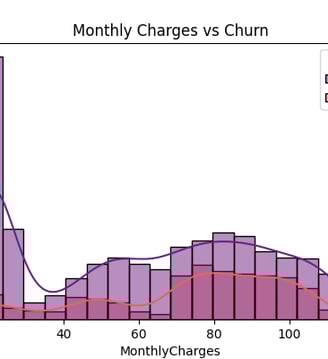
Monthly Charges vs Churn
Confusion matrix
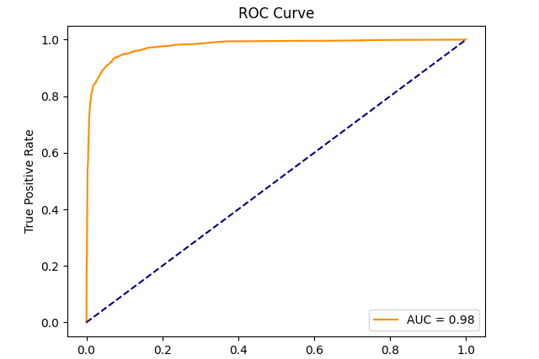
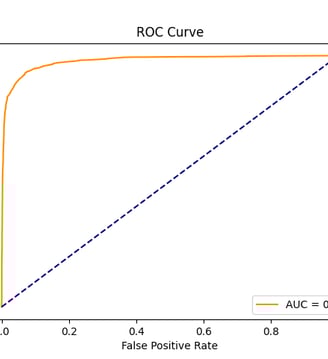
ROC curve
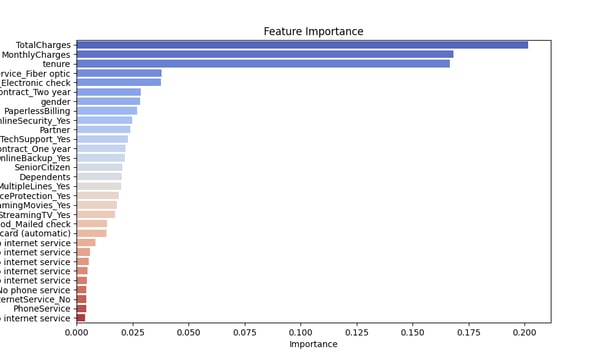
Feature importance using model.feature_importances_
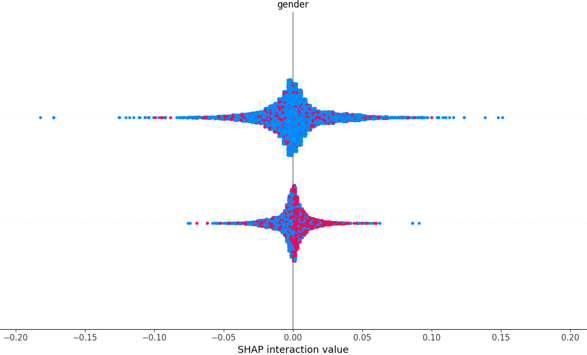
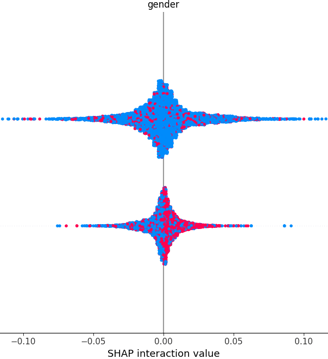
SHAP explainability with summary plots
Step 5: Automated Report Generation
PDF report generation using FPDF
Includes performance metrics, plots, and visual explanations
All saved to reports/ and plots/ folders
SHAP (SHapley Additive exPlanations) was used to identify the most influential features leading to churn. This allows:
Business users to understand why a prediction was made
Developers to fine-tune models based on feature behavior
Trust and transparency in AI systems
Common influential features include:
Tenure
Monthly Charges
Internet Service Type
Contract Type
Explainability with SHAP
Visual Analytics & Interpretations
The project includes rich visual insights to help understand key churn drivers and behavioral patterns among customers. These visualizations were generated from the original dataset and saved as part of the reporting pipeline:
Churn Distribution – Displays the proportion of churned vs. retained customers to highlight class imbalance.
Tenure vs. Churn – A box plot showing how long-term customers are less likely to churn compared to short-tenure users.
Monthly Charges vs. Churn – Visualizes how higher charges correlate with increased churn rates.
Confusion Matrix – Evaluates the classification performance, showing true positives, false positives, etc.
ROC Curve – Demonstrates the model’s performance across thresholds, indicating its ability to distinguish churners.
SHAP Summary Plot – A feature importance visualization showing which variables contributed most to predictions.
These plots provide business leaders and data teams with powerful, explainable insights for proactive decision-making.
✅ End-to-end churn prediction pipeline
✅ Model training, evaluation, and serialization
✅ Inference for both CSV and manual entry
✅ Dashboard using Streamlit
✅ Visual insights and SHAP interpretability
✅ Exportable reports and charts
✅ Sample new customer simulator
✅ Clean modular code with real-world structure
Key Deliverables
Tools and Libraries Used
pandas – Used extensively for data loading, manipulation, and preprocessing in all scripts.
numpy – Used for numerical operations and handling NaN/inf.
scikit-learn –
ML models: Random Forest Classifier
Preprocessing: LabelEncoder, StandardScaler
Evaluation: accuracy, precision, recall, F1, confusion matrix, etc.
joblib – For saving and loading models, encoders, scaler, training columns.
matplotlib – For visual plots (confusion matrix, ROC curve, etc.).
seaborn – Used in EDA visuals like churn distribution, boxplots, histograms.
shap – For SHAP summary plot and dependence explanation.
fpdf – For automated PDF report generation.
streamlit – Used in deploy streamlit.py for the web UI.
os – For path handling and creating directories (os.makedirs, os.path.join).
Add alert system for high-risk customers
Integrate with CRM or customer support tools
Monitor model performance over time
Deploy as API for real-time integration
Compare multiple models like XGBoost or CatBoost
Segment churn by customer type or channel
Enable lifecycle value prediction with retention modeling
Possible Next Steps & Conclusion
Conclusion
This AI-powered solution elevates traditional churn prediction into a full-fledged decision-support system that bridges data science and business action. It begins by transforming raw, fragmented customer data into structured intelligence, enabling companies to predict churn with high accuracy and — more importantly — understand the key drivers behind it.
What sets this solution apart is not just the predictive power of the machine learning model, but its explainability. By integrating SHAP (SHapley Additive exPlanations), the system offers clear, human-readable justifications for each prediction. This transparency is critical for adoption in real-world enterprise environments, where decision-makers demand both performance and trust. Stakeholders can go beyond “who will churn” to “why” they might churn — and what can be done about it.
The platform also emphasizes usability. Through interactive visualizations, a Streamlit-powered interface, and automated PDF reporting, the solution ensures insights are not locked behind code — they are accessible to analysts, marketers, and executives alike. This makes it not just a data science tool, but a strategic business asset.
As a scalable framework, this churn prediction system can be extended to:
Run in real-time with live data integrations
Feed CRM tools to trigger targeted retention workflows
Power loyalty scoring systems or upsell strategies
Serve as a foundation for customer lifetime value prediction and segmentation
In short, this project is not just about detecting churn. It’s about giving organizations a clear, data-backed lens into customer behavior, so they can retain more users, grow smarter, and future-proof their engagement strategies.
Dive into the foundational concepts, algorithms, and real-world relevance behind this project. From machine learning principles to business strategy insights, this conceptual study bridges the gap between technical implementation and applied decision-making—helping you understand not just how it works, but why it matters.
Key Concepts
GitHub Repository
Want to dive deeper into how this project actually works?
We’ve made the complete codebase and resources available for you on GitHub
👉 Access the full repository here:
Whether you're a learner, recruiter, or collaborator — there's something for everyone.
Connect
Join us in shaping the future of leadership.
Innovate
contact@youlead.com
© 2025. All rights reserved.