Business Health Dashboard
(AI Augmented)
Streamlined insights into sales, customers, and finance using real-world analytics
Project Overview
This project transforms real-world retail data into a dynamic decision-support system that reveals how your business is performing across revenue, customer engagement, and financial health. By combining modular Python analytics with an interactive Streamlit dashboard, it offers leaders and analysts a single source of truth for monitoring KPIs, exploring behavioral trends, and identifying profit levers. Whether you're diagnosing churn, analyzing category-level margins, or tracking quarterly growth, this tool bridges raw data and boardroom-ready insights — in real time.


Objective & Business Context
Organizations today demand integrated views of their business performance. This project delivers a real-time dashboard that consolidates insights from sales, customer behavior, and profitability into one comprehensive view.
Core Objectives:
Create a modular, reusable analytics platform across departments
Use engineered KPIs and behavioral metrics for decision support
Present digestible, interactive visuals for leaders and analysts
Why it Matters: Retailers and B2B firms alike face increasing pressure to understand where they're profitable, who their best customers are, and how their segments are performing over time. This dashboard solves that with clean design, rich metrics, and extendable logic.
Business Value and Real-World Scope
A business health dashboard like this goes beyond analytics — it offers decision clarity. Here's how it delivers strategic value:
Retail & E-commerce: Continuously assess seasonal trends, spot underperforming SKUs, measure marketing ROI, and monitor regional/categorical sales. It enables merchandising teams to quickly pivot strategies based on real-time profitability and product lifecycle.
Mid-size Enterprises: Transform static Excel reviews into automated dashboards for quarterly business updates. Visual financial summaries and customer lifecycle reports help align sales, finance, and strategy leaders on common KPIs.
Decision Support Systems: The modular code and lightweight deployment enable seamless integration as a reporting layer atop existing databases or cloud infrastructure. It serves as a plug-and-play interface for business heads, enabling self-serve analytics with minimal setup.
This project creates a repeatable analytics foundation that can be adopted across industries to simplify complexity and drive insight-led operations.
Implementation Flow
Dataset Used: superstore.csv — a structured retail dataset widely used for sales and operations analysis.
Raw Columns:
Order Date, Ship Date, Region, Segment, Country, Product, Category, Sub-Category, Sales, Quantity, Discount, Profit, Customer ID, etc.
Engineered Columns:
Profit Margin (%)
RFM Score (Recency, Frequency, Monetary value)
Category Discount Index
Customer Lifetime Sales
Data Size:
~10,000 rows × 20+ columns, cleaned and filtered for regional analytics
Dataset Overview
Step 1: Preprocessing and Cleaning
Datetime parsing for Order and Ship dates
Normalization of categories and discount values
Removed outliers from Sales and Profit using IQR thresholds
Step 2: Feature Engineering and KPIs
preprocess.py – Engineered sales growth, margin, and discount metrics
feature_engineering.py – Computed RFM scores and mapped customer personas
Step 3: Modular Analytics
sales_analysis.py – Trends, seasonality, top SKUs, discount vs profit scatter
customer_analysis.py – RFM heatmaps, churn indicators, top customers
financial_analysis.py – Monthly gross profit, profit margin, category ROI
Step 4: Streamlit Dashboard
Main UI in dashboard.py
Real-time filters (year, region, category)
KPIs: Total Sales, Total Profit, Avg Order Value, Profit Margin
Interactive charts using Plotly
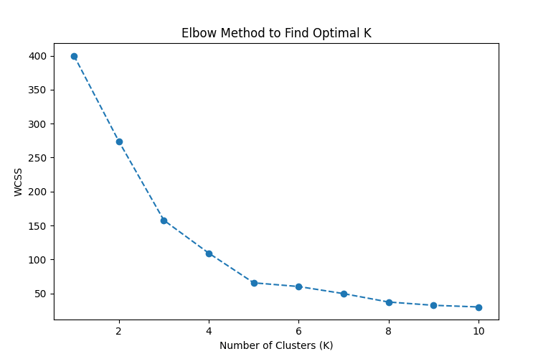
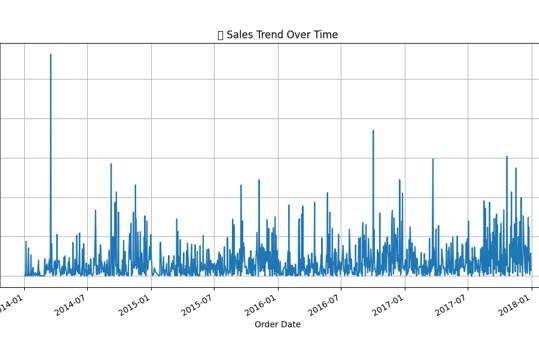
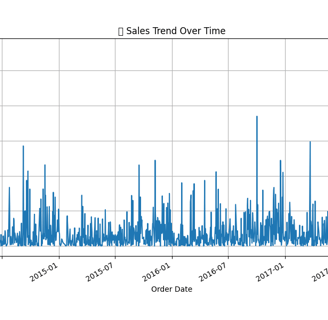
Visual Analytics & Interpretations
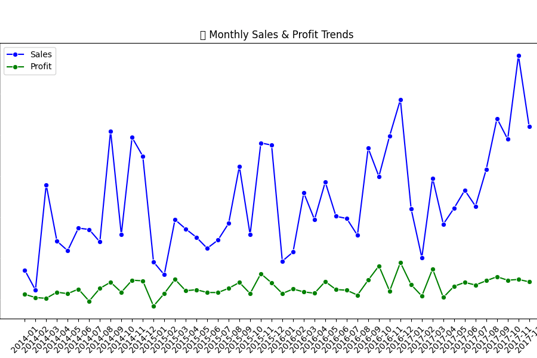
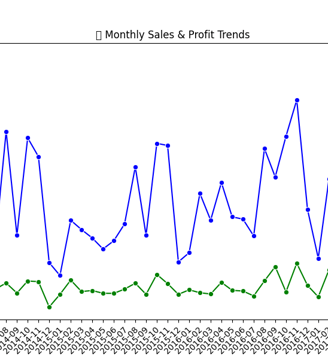
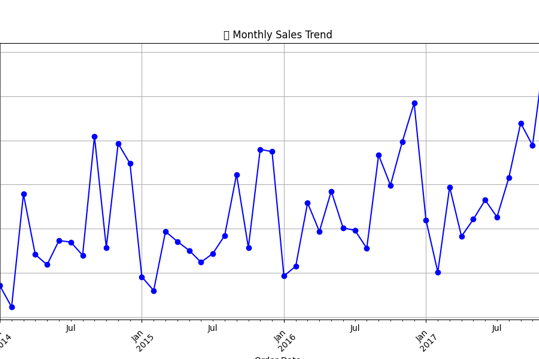
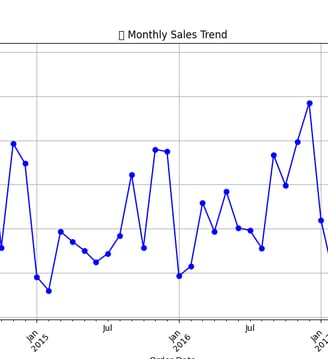
Sales Trendline: Reveals long-term revenue growth and detects key inflection points such as post-discount recovery, seasonal dips, or Q4 holiday booms. Businesses can align this with campaign performance or budget cycles.
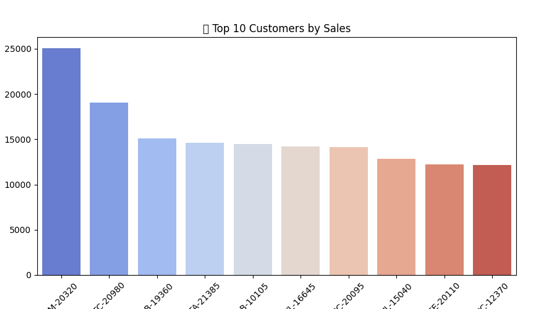
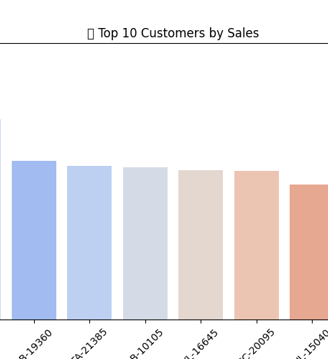
Top Customers View: Surfaces the Pareto distribution where a small number of clients drive a majority of the revenue. Critical for account-based strategies or loyalty programs.
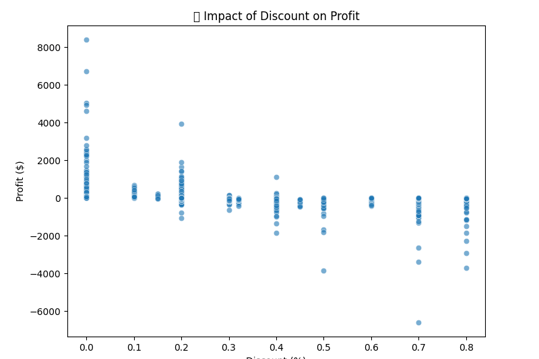
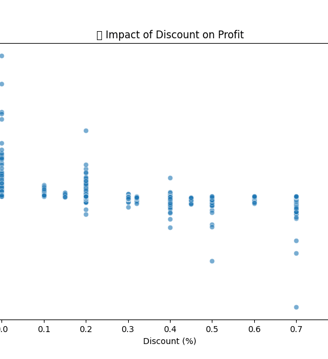
Profit vs Discount Scatterplot: Helps discover when higher discounts drive more sales vs. when they erode margins. This is essential for promo planning and profitability modeling.
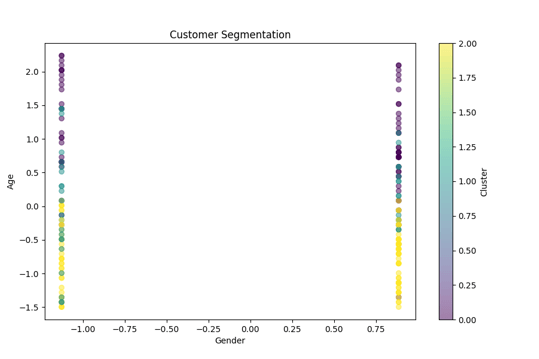
RFM Heatmap: Breaks down customers based on recency, frequency, and monetary value. Useful for customer retention planning and prioritizing high-value leads.
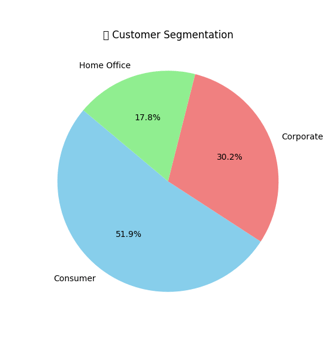
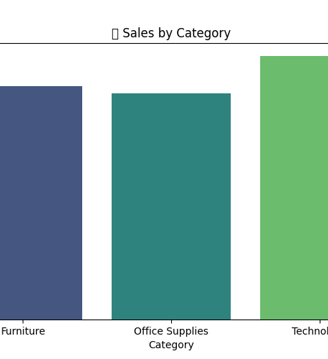
Region-Level Pie & Bar Charts: Provide quick comparative insights into geographical performance, useful for area managers or territory reviews.
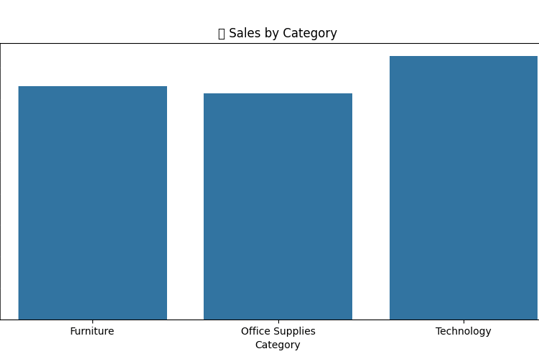
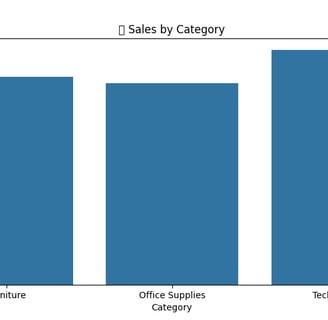
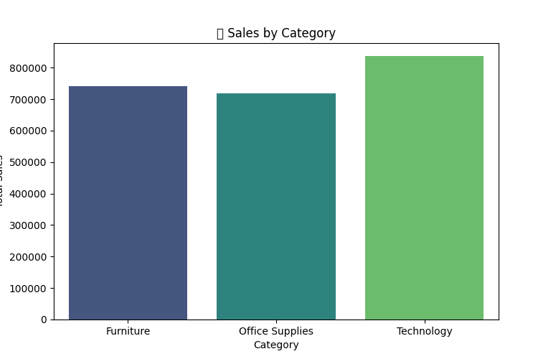
Category ROI Plot: Maps which categories deliver high returns relative to volume, helping optimize SKU mix and category management.
All visuals replicate real use cases from business review decks and internal reporting dashboards, enabling ready adoption in enterprise settings.

✅ Streamlit Dashboard with interactive filters and KPIs
✅ Sales, customer, and financial analytics modules (Python scripts)
✅ Cleaned & enhanced dataset enhanced_superstore.csv
✅ Monthly and regional trends visualized with export options
✅ RFM-based customer intelligence embedded into dashboard
✅ Graphs and insights aligned with real business review questions
Key Deliverables
Tools and Libraries Used
VS Code Terminal - Used to execute and test scripts, manage environments
pandas – for data cleaning, manipulation, and group by aggregations
numpy – for numerical transformations and RFM scoring
matplotlib & seaborn – for line plots, scatterplots, and heatmaps
plotly – for interactive bar charts, pie charts, and dynamic plots
streamlit – to build the full business-facing dashboard interface
datetime, os – for date parsing, file handling, and runtime control
Enable Real-Time Data Sync: Integrate APIs or database connectors (e.g., to PostgreSQL or BigQuery) for live data streaming and up-to-the-minute reporting.
Integrate Predictive Analytics: Layer in forecasting techniques using Facebook Prophet, XGBoost, or LSTM to anticipate future trends based on historical KPIs.
Add Drill-Down Capabilities: Allow users to click on visuals and explore underlying transactions for root-cause analysis and financial auditing.
Incorporate Textual Insights: Apply NLP on support tickets or reviews to merge qualitative insights with quantitative dashboard metrics.
Automated Reporting & Alerts: Embed logic that sends weekly or monthly PDF summaries to leadership or triggers alerts when KPIs breach defined thresholds.
Role-Based Access & Custom Views: Tailor dashboard perspectives by user roles — e.g., region managers see only their geography, finance sees profitability by cost centers.
Possible Next Steps & Conclusion
Conclusion
This project demonstrates how AI-powered analytics can be structured to align tightly with business needs — not just by tracking metrics, but by translating them into decisions. The Business Health Dashboard is more than a reporting tool; it’s a living system that reflects your organization’s pulse.
It empowers:
Executives with real-time decision context
Analysts with modular code for deeper investigation
Customer teams with behavioral segmentation
Finance teams with margin and discount analysis
By turning a static dataset into an interactive business layer, this dashboard shows how data engineering, visual storytelling, and real-world strategy can be woven together to make analytics truly actionable.
Dive into the foundational concepts, algorithms, and real-world relevance behind this project. From machine learning principles to business strategy insights, this conceptual study bridges the gap between technical implementation and applied decision-making—helping you understand not just how it works, but why it matters.
Key Concepts
GitHub Repository
Want to dive deeper into how this project actually works?
We’ve made the complete codebase and resources available for you on GitHub
👉 Access the full repository here:
Whether you're a learner, recruiter, or collaborator — there's something for everyone.
Connect
Join us in shaping the future of leadership.
Innovate
contact@youlead.com
© 2025. All rights reserved.