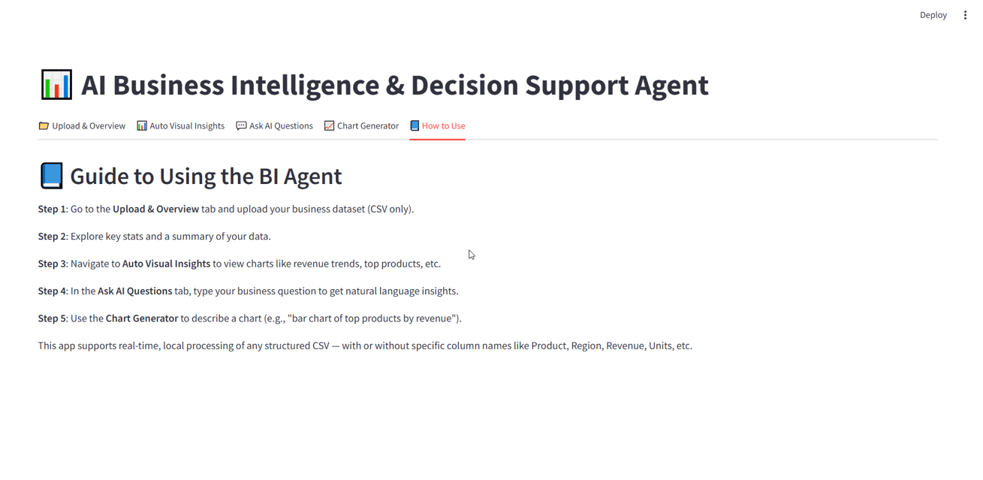
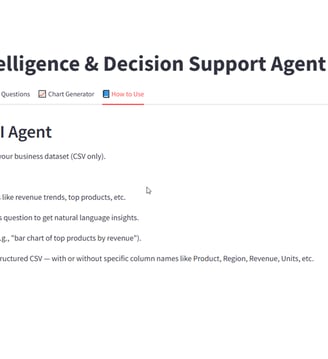
AI Business Intelligence & Decision Support Agent
Interactive analytics powered by LLMs and charts for fast decision-making
Project Overview
This project enables real-time, interactive business intelligence on uploaded CSV datasets. Users can visualize key metrics, generate smart insights, and ask natural language questions about the data. The system combines Streamlit dashboards with LangChain-powered LLM agents, vector search, dynamic charting, and smart summaries to support data-driven decision-making without needing advanced analytics skills.


Objective & Business Context
Businesses often need to analyze performance, identify trends, and answer questions based on data—but most decision-makers don’t know SQL or data visualization tools. This project solves that gap by offering:
A no-code, upload-and-analyze interface
Automated data summaries and smart visualizations
Natural language question support via local LLMs
It empowers non-technical users (e.g., product managers, small business owners, or educators) to access insights without needing a data science team.
Business Value and Real-World Scope
This project delivers value in multiple real-world contexts:
Small Businesses: Get instant visibility into sales, inventory, or customer metrics.
Analysts: Accelerate exploratory data analysis without writing queries.
Managers & Executives: Ask plain-English questions and get structured insights.
Educators & Students: Use it as a learning and teaching tool for data interpretation.
Industries that benefit include e-commerce, finance, operations, healthcare, education, and retail. Because it is dataset-agnostic, it supports any structured CSV with columns like date, revenue, product, units, etc.
Implementation Flow
The tool supports any CSV file with structured data.
Columns are inferred as numeric, categorical, or datetime.
Summary metrics include:
Number of rows and columns
Missing value count
Column type breakdown (numeric, categorical, datetime)
Sample preview of data
Robust encoding fallback ensures most common CSV files (even non-UTF-8) can be processed.
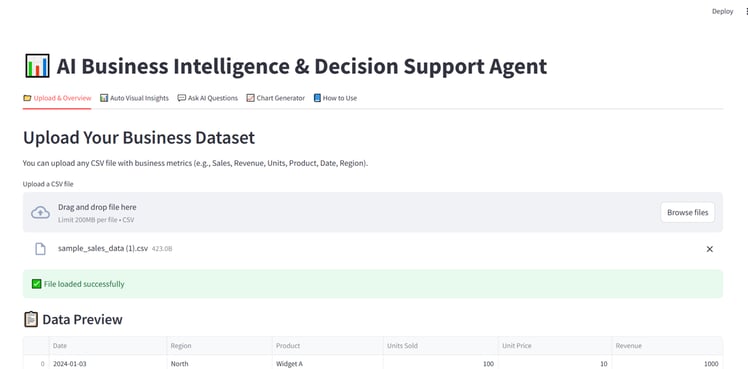
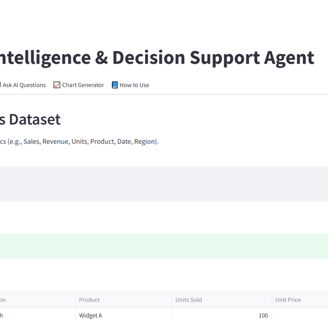
Dataset Handling & Overview
Data Preprocessing Workflow
When a file is uploaded:
Encoding Detection: Tries UTF-8, falls back to ISO-8859-1 if needed.
Column Inference: Determines column types using pandas.
Date Conversion: Automatically parses date columns using errors='coerce'.
Missing Value Count: Captures and reports NaNs.
Dataset Summary Generation: Produces a snapshot of structure before analysis.
These steps make it robust for heterogeneous business data formats.
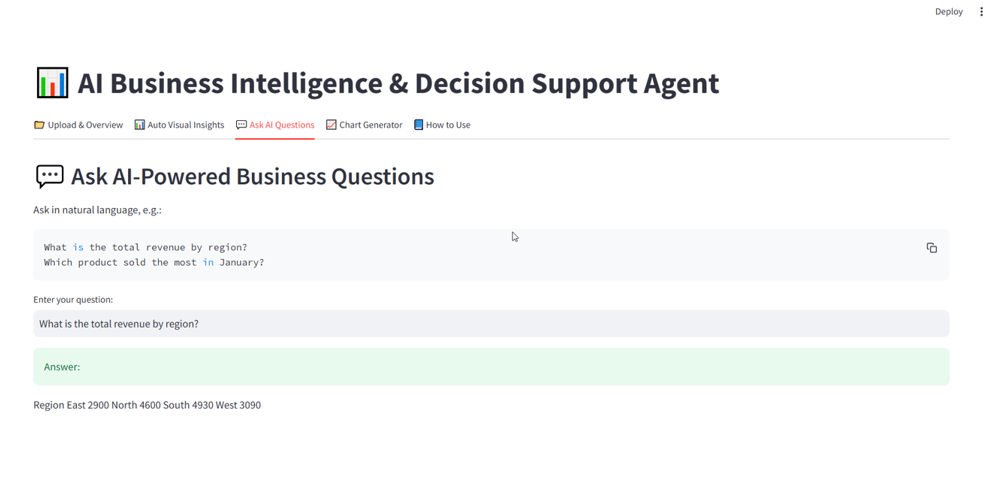
LLM-Based Natural Language Questioning
Users can ask direct business questions such as:
"Which product generated the highest revenue?"
"What is the average unit price across all regions?"
"Which month saw the most sales activity?"
How it works:
The dataset is chunked and embedded using Hugging Face Embeddings.
FAISS handles similarity-based retrieval.
Custom Python logic parses the question and:
Applies hardcoded logic for 10+ popular business questions
Falls back to LangChain’s RetrievalQA with GPT4All (Mistral model)
This hybrid approach ensures faster, more accurate answers.
Conversational Agent Logic
A simplified Retrieval-Augmented Generation (RAG) framework is used:
Converts CSV to searchable documents
Uses local Mistral model (via GPT4All)
Responds in human-readable text format
Balances retrieval logic with fallback reasoning
This ensures privacy, efficiency, and transparency over cloud-hosted AI APIs.
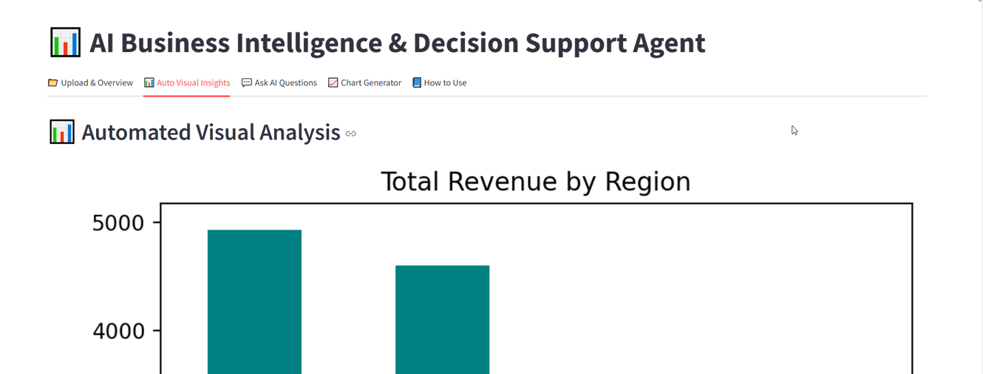
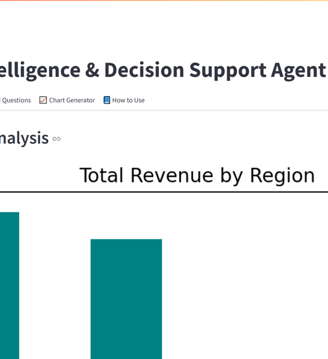
Visual Analytics & Interpretations
The app generates multiple ready-to-view plots:
Revenue by Region
Top-Selling Products
Revenue Trends Over Time
Units Sold Over Time
Revenue by Product and Region
Correlation Heatmap (if >1 numeric column)
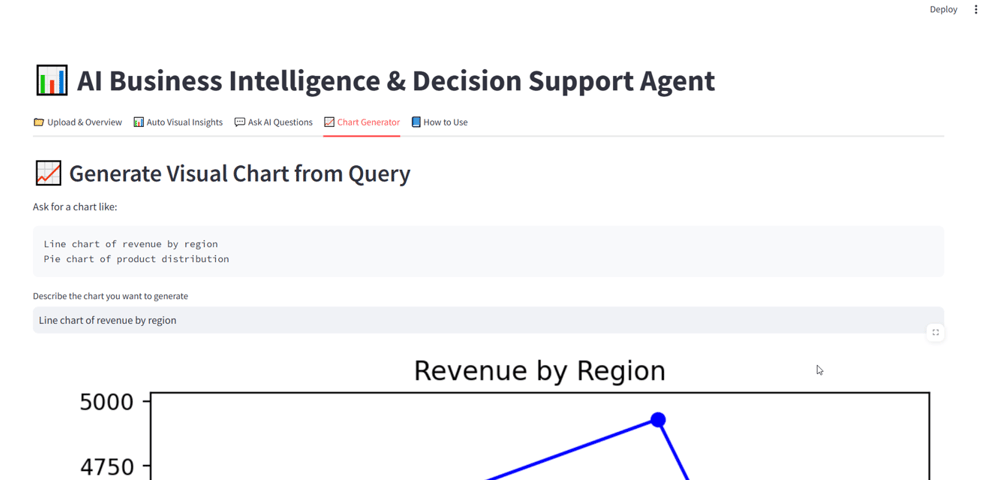
Smart Chart from Query:
Users can type queries like:
“Show a pie chart of revenue by region”
“Line chart of Widget A sales over time”
“Top 2 regions by sales”
The system infers chart type and generates a downloadable visual using matplotlib.
✅ Upload-based Streamlit interface
✅ Dataset preview and summary
✅ Visual analytics (bar, pie, line, heatmap)
✅ Smart chart generation from query
✅ Plain-English business question support
✅ Vector-based document embeddings
✅ RAG-style logic for fallback queries
✅ Local LLM support (no cloud required)
✅ Dataset-agnostic analysis
Key Deliverables
Tools and Libraries Used
pandas – CSV loading, preprocessing, and analysis
matplotlib – Charts and visual insight generation
seaborn – Enhanced visualizations like heatmaps
streamlit – Web-based UI for interaction
langchain – Handles prompt logic and connects vector store to LLM
FAISS – Vector similarity search for question retrieval
Hugging Face Embeddings – Converts tabular text into vectors
gpt4all with Mistral – Local LLM model used to answer questions
os, io, tempfile – Support for file uploads and image streaming
Enable PDF report generation
Add Excel/XLSX file support
Build chatbot memory with LangChain Memory
Filter/sort data before analysis
Extend LLM fallback for broader Q&A
Role-based access or user login
Add voice command or Slack integration
Possible Next Steps & Conclusion
Conclusion
This project bridges the gap between data and decision-making by offering a smart, interactive interface for business users to explore and understand their datasets — without needing technical expertise.
By combining AI-driven question answering, automated charting, and flexible CSV handling, it empowers users to move from raw data to clear insights instantly. Whether for small business owners, product managers, educators, or analysts, this tool provides a fast, adaptable way to extract value from any structured dataset.
It showcases how thoughtful integration of LLMs and visualization tools can turn static data into a dynamic decision support system — paving the way for a more intuitive, accessible future of business intelligence.
Dive into the foundational concepts, algorithms, and real-world relevance behind this project. From machine learning principles to business strategy insights, this conceptual study bridges the gap between technical implementation and applied decision-making—helping you understand not just how it works, but why it matters.
Key Concepts
GitHub Repository
Want to dive deeper into how this project actually works?
We’ve made the complete codebase and resources available for you on GitHub
👉 Access the full repository here:
Whether you're a learner, recruiter, or collaborator — there's something for everyone.
Connect
Join us in shaping the future of leadership.
Innovate
contact@youlead.com
© 2025. All rights reserved.