AI-Powered Marketing Campaign Optimizer
Drive smarter marketing strategies with predictive modeling and A/B testing
Project Overview
This project uses machine learning and A/B testing to predict whether a customer will subscribe to a term deposit. By analyzing patterns in bank marketing data, we built an explainable model that identifies key customer traits, visualizes campaign effectiveness, and automates the entire workflow. It integrates feature selection, model training, evaluation, SHAP interpretation, and experimental design into one seamless pipeline.


Objective & Business Context
In an era of customer-centric marketing, traditional one-size-fits-all campaigns fail to achieve strong ROI. Businesses need intelligent systems to predict which customers are likely to convert and tailor strategies based on data-driven insights.
Marketing teams in banking often struggle to predict which customers are likely to respond to term deposit campaigns. Manual targeting can be inefficient and lead to missed conversions or over-marketing to uninterested users.
This project simulates an AI-powered system that:
Predicts which customers will subscribe to a term deposit (marketing success)
Identifies key features driving decisions (e.g., age, previous contact, balance)
Optimizes campaigns using feature-based segmentation and A/B/C group allocation
Evaluates campaign performance using statistical significance testing
Enhances explainability through SHAP plots for trust and insight
Business Value and Real-World Scope
Marketing Teams: Precision targeting, segment-specific messaging
Campaign Managers: Better allocation of effort, smarter promotions
Product Teams: Understand customer behavior patterns and bottlenecks
Strategy Leaders: Simulate and analyze A/B testing outcomes before investment
Implementation Flow
Source: UCI Bank Marketing Dataset (bank.csv)
Size: 11,162 rows, 17 columns
Target: deposit – binary classification (yes, no)
Notable Features:
Categorical: job, marital, education, contact, month, outcome
Numerical: age, balance, duration, campaign, previous
Dataset Overview
Data Preprocessing Workflow
Cleaned missing values
Label-encoded all categorical features
Scaled numerical columns using StandardScaler
Saved to bank_processed.csv
Feature Engineering
Performed Mutual Information analysis
Selected top 5 features influencing deposit behavior
Saved to bank_selected_features.csv
Model Training
Used RandomForestClassifier (100 trees)
Trained on selected features
Evaluated using accuracy score
Model saved as campaign_model.pkl
Model Evaluation
Campaign Optimization & SHAP Analysis
Generated classification_report and confusion_matrix
Accuracy: ~89%
Evaluation shown via CLI output
Extracted feature_importance and plotted
Used SHAP to explain model decisions
Visualized global summary plot for transparency
Output plots saved in reports/figures/
A/B/C Testing Simulation
Customers segmented into:
A: High Balance
B: General
C: Returning Customers
Campaign assignments made based on segments
Chi-Square test used to check statistical significance
Conversion rates plotted and saved
Automated Pipeline Execution
All scripts executed using automated_pipeline.py
Ensures reproducibility and streamlined deployment
Visual Analytics & Interpretations
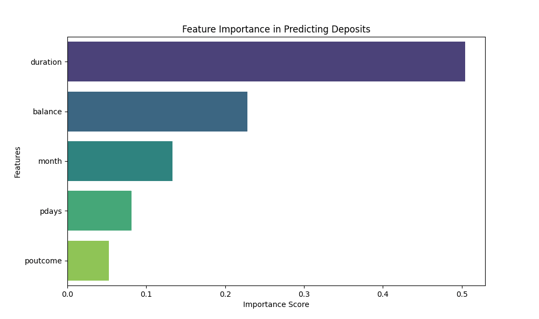
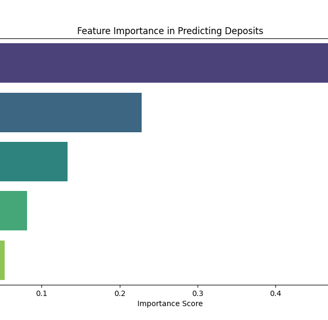
feature_importance.png
Bar chart showing top 5 features influencing deposit predictions (e.g., duration, balance, month, etc.) via Random Forest feature importance.
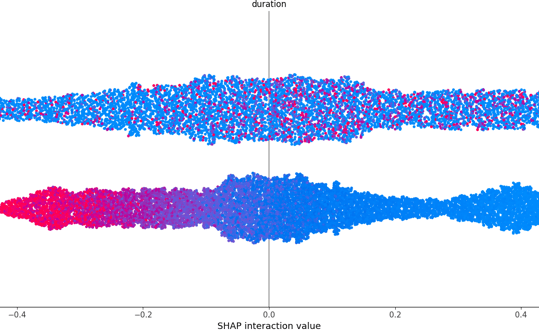
shap_summary_campaign.png
SHAP interaction summary plot for the top feature (duration), revealing its effect on model output across all customers.
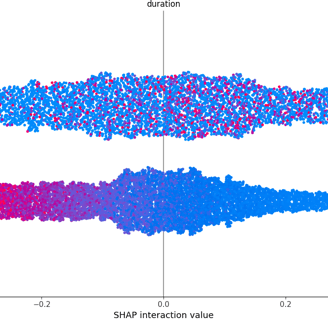
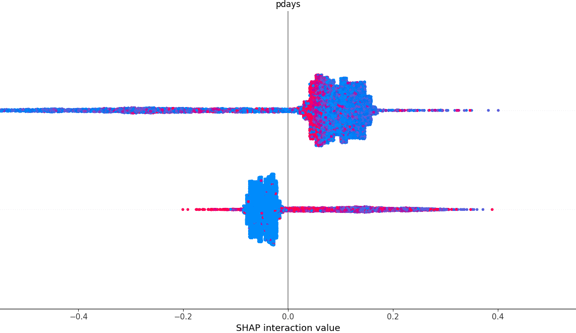
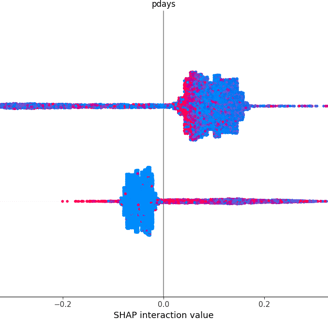
shap_summary_plot.png
SHAP interaction summary plot for another top feature (pdays), giving transparency into how the number of days since the last contact influences predictions.
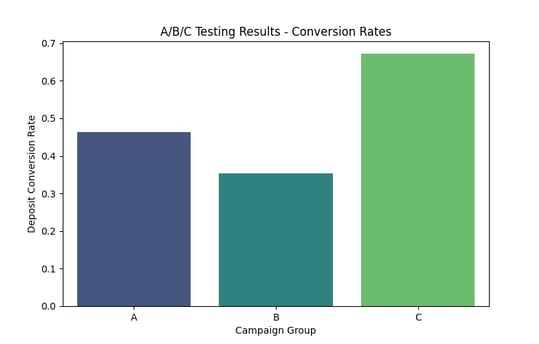
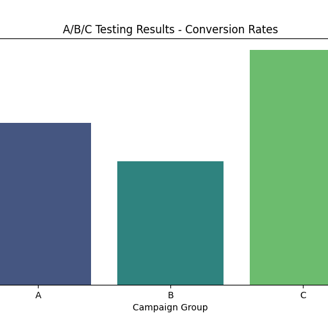
ab_test_results.png
Bar plot of deposit conversion rates for Campaign Groups A, B, and C, derived from A/B/C segmentation strategy.
✅ A complete data preprocessing pipeline implemented in data_preprocessing.py that handles missing values, encodes categorical features, and scales numerical ones.
✅ Feature selection logic using Mutual Information in feature_engineering.py with output saved to bank_selected_features.csv.
✅ Model training script model_training.py that builds and saves a Random Forest model for predicting deposit conversions.
✅ Model evaluation performed via model_evaluation.py with accuracy score, classification report, and confusion matrix printed for validation.
✅ A dedicated SHAP analysis pipeline (shap_explain.py) and integration in campaign_optimizer.py, generating deep visual explanations for model behavior.
✅ A campaign optimization script (campaign_optimizer.py) to visualize feature importance and top SHAP factors affecting customer decisions.
✅ An A/B/C testing module in ab_testing.py to simulate campaign performance and analyze conversion rates using Chi-Square statistics.
✅ Automated end-to-end pipeline in automated_pipeline.py that executes all steps sequentially for ease of testing and reproducibility.
✅ A set of insightful visualizations saved under reports/figures/, including SHAP plots, feature importance charts, and A/B/C test results.
✅ All datasets (bank.csv, bank_processed.csv, bank_selected_features.csv) and trained models (campaign_model.pkl, campaign_model_pipeline.pkl) versioned and saved for reuse and deployment.
✅ Linked conceptual study document to explain the theory, design decisions, and real-world relevance of the entire solution.
Key Deliverables
Tools and Libraries Used
pandas – Data manipulation, cleaning, and loading CSV files
numpy – Numerical computations and array operations
scikit-learn – Machine learning algorithms (Random Forest), preprocessing (LabelEncoder, StandardScaler), evaluation metrics
matplotlib – Creating bar plots and SHAP visualizations
seaborn – Enhanced visualization styling for plots
shap – Model interpretability using SHAP value analysis
joblib – Saving and loading trained models
subprocess – Automating script execution in the pipeline
os – Handling file paths, directories, and validations
VS Code Terminal – Used to run individual scripts and monitor outputs step-by-step
Integrate automated hyperparameter tuning to boost model performance
Build a lightweight Streamlit dashboard for real-time marketing insights
Extend SHAP-based insights across customer segments
Containerize the full pipeline for scalable deployment
Introduce time-based trends to capture seasonal effects
Possible Next Steps & Conclusion
Conclusion
This project showcases how data-driven intelligence can elevate traditional marketing approaches by identifying what truly influences customer decisions. Through feature selection, predictive modeling, SHAP-based explainability, and conversion-focused A/B/C testing, we’ve built a robust and interpretable pipeline that mirrors real-world decision flows in campaign planning. Each module is modular, scalable, and geared for practical use, making it a solid fit for business teams and analysts. With clear outputs and actionable insights, this solution provides a strong foundation for smarter targeting, improved ROI, and long-term marketing efficiency.
Dive into the foundational concepts, algorithms, and real-world relevance behind this project. From machine learning principles to business strategy insights, this conceptual study bridges the gap between technical implementation and applied decision-making—helping you understand not just how it works, but why it matters.
Key Concepts
GitHub Repository
Want to dive deeper into how this project actually works?
We’ve made the complete codebase and resources available for you on GitHub
👉 Access the full repository here:
Whether you're a learner, recruiter, or collaborator — there's something for everyone.
Connect
Join us in shaping the future of leadership.
Innovate
contact@youlead.com
© 2025. All rights reserved.