AI-Powered Customer Segmentation
ML-based clustering to group customers for personalized marketing or other business needs
Project Overview
This project applies machine learning techniques to segment mall customers based on their income and spending habits. By clustering customers into distinct behavioral groups, businesses can optimize marketing efforts and personalize engagement. The insights derived from this clustering model are presented through visual plots and interpretable summaries to support strategic business decisions.
Objective & Business Context
Customer segmentation is a vital strategy used by companies to understand diverse customer needs. In this project, we aimed to identify distinct groups of customers using unsupervised learning, specifically the K-Means clustering algorithm. The focus was to analyze customers based on their Annual Income and Spending Score to enable:
Targeted and personalized marketing strategies
Better resource allocation
Improved customer engagement and retention
Business Value and Real-World Scope
Customer segmentation is not just a theoretical exercise — it drives real-world value:
Retail Sector: Tailored promotions and inventory planning
Banking: Differentiated credit card or loan offers
Telecom: Churn prediction and loyalty rewards
Hospitality: Loyalty tier targeting and upselling experiences
E-commerce: Personalized recommendation engines
Real-time, AI-powered segmentation can also enable dynamic campaign adaptation and micro-persona based outreach, fueling hyper-personalized strategies at scale.
Implementation Flow
Dataset Source: Mall Customers Dataset
Features:
CustomerID: Unique ID (removed for modeling)
Gender: Categorical (encoded to numerical)
Age: Numerical
Annual Income (k$): Numerical, continuous
Spending Score (1–100): Numerical, ordinal
The focus for clustering was primarily on Annual Income and Spending Score, which provide a direct view into consumer purchasing power and behavior.
Dataset Overview
Data Preprocessing Workflow
Before applying any ML model, raw data must be cleaned, transformed, and normalized. Our data preparation process included
Removing Irrelevant Features: Dropped CustomerID since it does not convey meaningful clustering attributes.
Encoding Categorical Variables: Transformed Gender to numeric values (Male → 0, Female → 1) to facilitate compatibility with machine learning models.
Handling Duplicates: Identified and removed duplicate records to prevent biased cluster assignment.
Feature Selection: Focused on two primary features (Annual Income (k$) and Spending Score) for effective visualization and model simplicity.
Standardization with StandardScaler: Scaled the features using z-score normalization to ensure equal contribution in distance-based calculations by K-Means.
This preprocessing ensured the input space was optimized for accurate and meaningful clustering.
The core of this project involved applying the K-Means algorithm to find natural groupings in the data. Here's the full methodology:
Feature Selection: We began with Annual Income and Spending Score, known to strongly influence customer behavior.
Data Normalization: These features were standardized using StandardScaler to account for differences in units and scale.
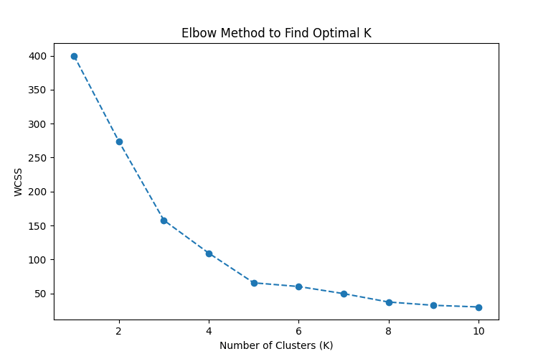
Finding Optimal K: The Elbow Method was used to determine the ideal number of clusters. We calculated the Within-Cluster Sum of Squares (WCSS) for K values from 1 to 10 and plotted the results. The 'elbow point' in the graph, where WCSS stops decreasing sharply, suggested K = 3.
Running K-Means: We then applied the K-Means algorithm with n_clusters = 3. The algorithm iteratively updated centroids and re-assigned data points until convergence.
Cluster Labeling: The output was a cluster label assigned to each customer. These labels were appended to the original dataset.
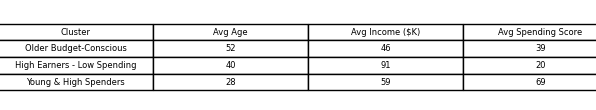
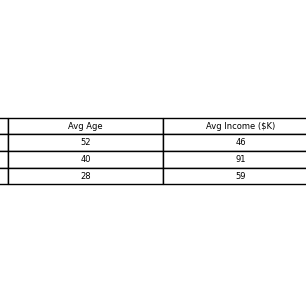
Cluster Profiling: Aggregated metrics such as average income and spending per cluster were computed to interpret customer types.
Clustering Methodology
Visual Analytics & Interpretations
Elbow Method Plot: Helped in selecting the optimal number of clusters by identifying the point of diminishing returns in WCSS.
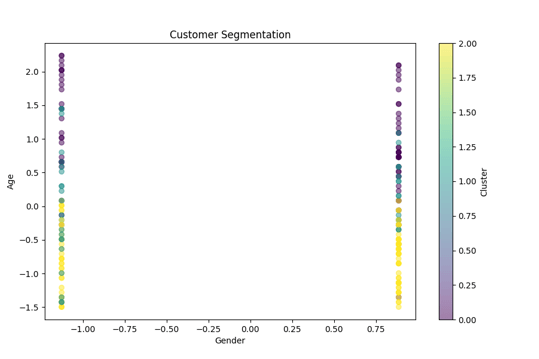
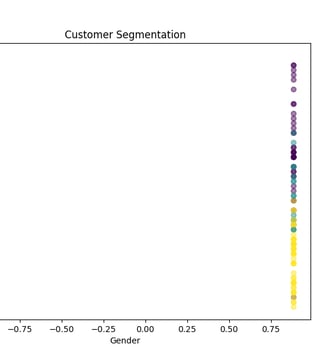
Cluster Scatter Plot: Visual representation of customer groups in 2D space. Each point represented a customer, colored based on assigned cluster.
These visuals provided easy-to-understand insights for non- technical stakeholders.
Interpretation of Clusters (with Business Implications)
These insights help in crafting segment-specific campaigns for better conversion and retention.
Cluster Segment Description Business Strategy Recommendation
0 High income but low Encourage via loyalty programs spending or premium upselling
1 Older, budget-conscious Offer discounts, value-for-money customers bundles
2 Young and high-spending Target with trendy and limited- shoppers time offers
✅ Customer_Segmentation_Results.xlsx with cluster labels
✅ cluster_summary.csv showing mean values per segment
✅ cluster_counts.csv showing number of customers per group
✅ Elbow Method Plot
✅ Cluster Visualization Plot
Key Deliverables
Tools and Libraries Used
pandas - Data manipulation, cleaning, loading CSV files
numpy - Mathematical computations and array handling
matplotlib - Visualizing elbow curve and scatter plots
seaborn(Optional) - Enhanced visualization styling
scikit-learn - Machine learning algorithms (KMeans, StandardScaler)
openpyxl - Exporting processed results to Excel for report generation
IPython.display - Displaying summary tables in Jupyter-style notebooks
VS Code Terminal - Used to execute and test scripts, manage environments
Incorporate More Features: Include Age, Gender, and purchase history to enhance cluster fidelity.
Try Hierarchical Clustering: Explore tree-based clustering to understand how groups merge.
Apply DBSCAN: Use density-based clustering to detect customer outliers or niche segments.
Build a Recommender System: Leverage cluster profiles to build segment-specific recommendation engines.
Deploy the Model: Integrate the clustering pipeline into a web app or dashboard for marketing teams.
Possible Next Steps & Conclusion
Conclusion
This project was a hands-on implementation of unsupervised machine learning for business segmentation. Through structured preprocessing, careful selection of K using the Elbow Method, and detailed profiling of clusters, we successfully grouped customers based on behavioral patterns.
The process highlighted the importance of scalable and interpretable models like K-Means in business environments, particularly when decisions need to be driven by data rather than assumptions.
Looking ahead, this segmentation approach can act as a foundation for building AI-powered recommendation systems, churn prediction models, and personalized customer journeys across industries.
Dive into the foundational concepts, algorithms, and real-world relevance behind this project. From machine learning principles to business strategy insights, this conceptual study bridges the gap between technical implementation and applied decision-making—helping you understand not just how it works, but why it matters.
Key Concepts
GitHub Repository
Want to dive deeper into how this project actually works?
We’ve made the complete codebase and resources available for you on GitHub
👉 Access the full repository here:
Whether you're a learner, recruiter, or collaborator — there's something for everyone.
Connect
Join us in shaping the future of leadership.
Innovate
contact@youlead.com
© 2025. All rights reserved.