AI-POWERED CUSTOMER SEGMENTATION (Advanced)
End-to-end business insights powered by data cleaning, feature engineering, and visual analytics
Project Overview
This advanced version of customer segmentation goes beyond standard clustering. It enriches raw marketing data through advanced feature engineering, PCA-based visualization, and AI-based prediction of high spenders — offering both exploratory and actionable intelligence.
It simulates a marketing analyst’s toolkit for uncovering latent patterns in customer behavior and empowering decision-makers with clear visual insights.
Objective & Business Context
In modern customer-centric industries, raw demographics and spending data often lie unused in flat tables. The project addresses these gaps by:
Segmenting customers based on nuanced behavioral signals like web purchases, recency, tenure, and lifetime spend.
Visualizing these segments in an interpretable, decision-friendly form.
Predicting high-spending customers using logistic regression to aid targeted marketing.
Such segmentation is crucial in retail, e-commerce, telecom, and banking, where user diversity and campaign efficiency directly affect revenue.
Business Value and Real-World Scope
Marketing ROI Boost: Use intelligent segmentation to tailor campaigns and reduce customer churn.
Predictive Customer Value: Pinpoint who’s likely to spend more, and when.
Behavior-Based Targeting: Move beyond basic demographics and toward lifecycle-driven campaigns.
Practical Deployment Ready: Streamlit dashboard offers stakeholder-ready insights in a single screen — no code required.
Scalable Approach: Easily extended to include RFM, CLTV, churn prediction, or multi-touch attribution models.
Implementation Flow
Dataset: marketing_campaign.csv
Source: Public retail campaign dataset on Kaggle
Key Fields:
Income, Age, TenureDays, TotalSpend
Product purchase data: MntWines, MntFruits, MntGoldProds, etc.
Behavioral engagement: NumWebPurchases, Recency, NumWebVisitsMonth
Demographics: Education, Marital Status, Kidhome, Teenhome
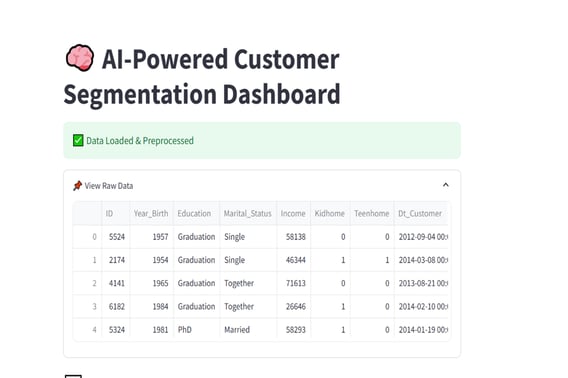
Dataset Overview
Data Preprocessing
Cleaned nulls, encoded types.
Derived new columns:
Age (from year of birth)
TotalSpend (sum of product category spend)
TenureDays (from customer registration date)
TotalChildren (combined from Kidhome + Teenhome)
Exploratory Data Analysis (EDA)
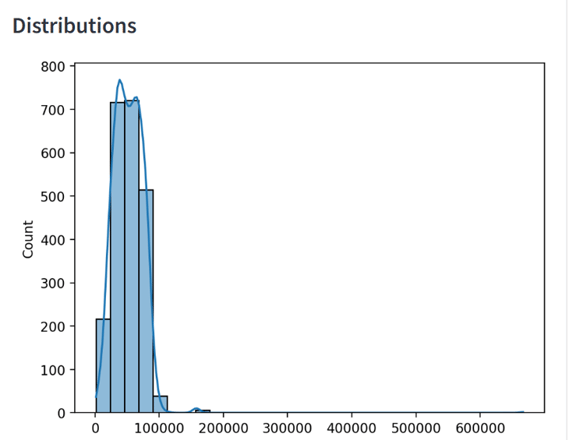
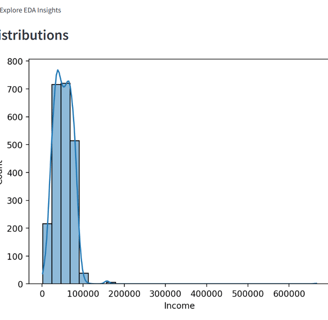
Visualized distributions (e.g. income, recency)
Plotted correlation matrix for behavioral patterns
Analyzed categorical fields like education/marital status
Clustering (Unsupervised Learning)
Used StandardScaler + KMeans on selected features
Segmented customers into 4 clusters (configurable)
Elbow method plotted to select optimal k
Pair plots and boxplots showed intra-cluster differences
Dimensionality Reduction (PCA)
Applied PCA for visualization (PC1, PC2)
Cluster overlays on PCA scatterplot
Explained variance tracked to ensure interpretability
High-Spender Classification (Supervised Learning)
High-spender logic: MntWines + MntMeatProducts > 500
Logistic regression trained on:
Income, Recency, Web Purchases, TotalSpend, Age
Generated predictions (SpendingPrediction) + evaluation metrics
Confusion matrix and classification report plotted
Streamlit Dashboard
Interactive filters, data previews
EDA plots, PCA plots, clustering visuals
Prediction summaries + downloadable results
Output File
customer_segments.csv – Includes:
Final cluster labels
Spending prediction (0 = low spender, 1 = high spender)
PCA values (PC1, PC2)
All relevant engineered features
🟡 This file is not saved locally by default. It is offered for download from the dashboard using st.download_button().
Visual Dashboard Overview
Histograms (Income, Recency, Total Spend, Age, Tenure)
Show the distribution of key traits like income and engagement. Help identify outliers and customer spread.
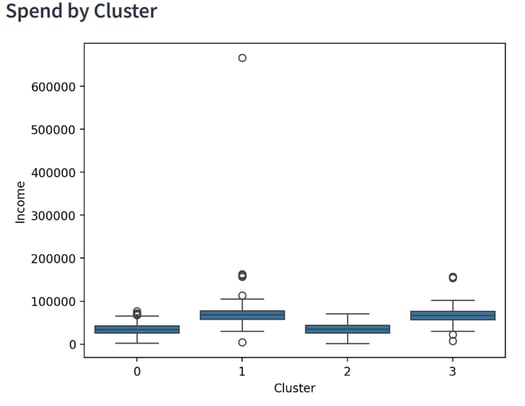
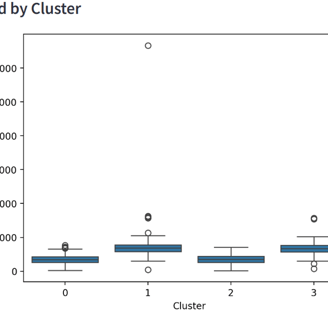
Boxplots (Income, Spend by Cluster)
Reveal spending and income variation across clusters. Useful for comparing financial value of each segment.
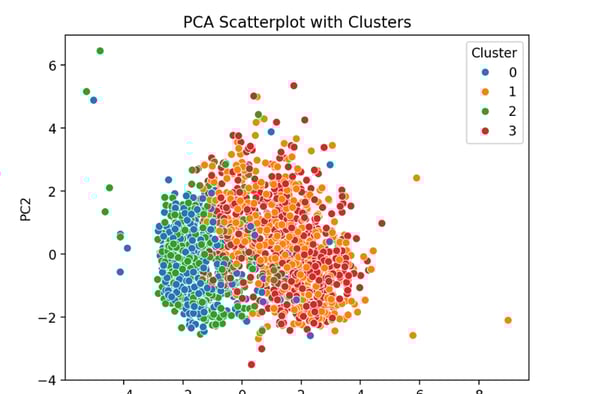
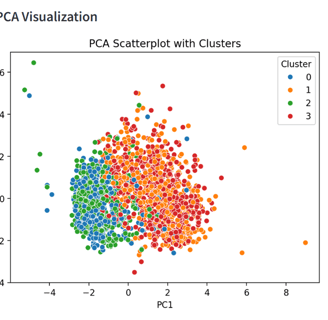
PCA Scatter Plot
Displays customers in a 2D space by similarity. Clearly shows how well clusters are separated.
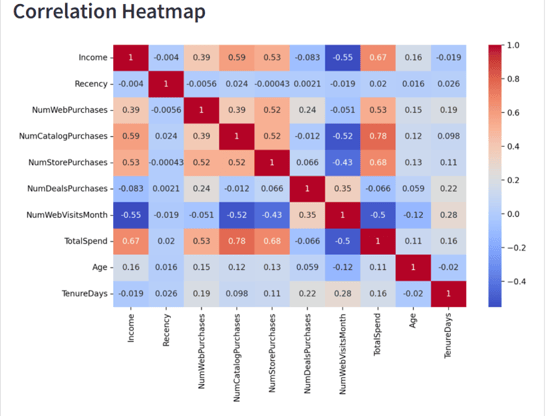
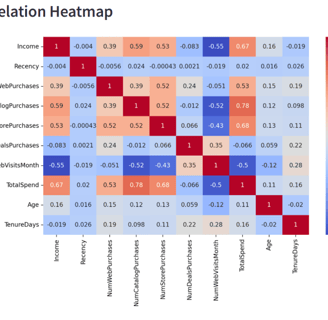
Correlation Heatmap
Highlights relationships between behaviors and demographics. Helps spot patterns like high income = high spend.
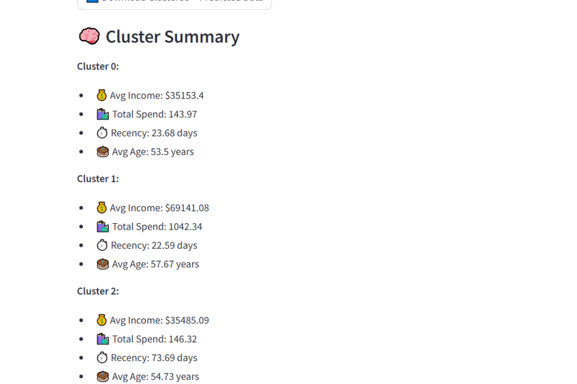
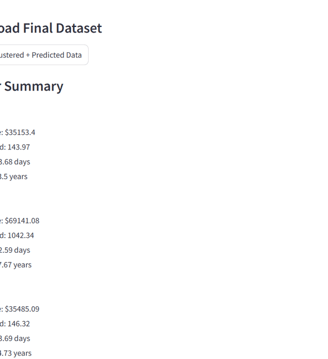
Cluster Summary Cards
Quick insights into each group’s income, age, and spending. Ideal for creating buyer personas.
CSV Export
Lets users download the enriched, segmented data. Enables deeper analysis in Excel or BI tools.
✅ customer_segments.csv – Exported clustered + predicted customer data
✅ Streamlit dashboard – Interactive controls and visual analytics
✅ Logistic Regression – High spender classification with evaluation metrics
✅ Documentation & Codebase – Fully structured for reuse or extension
Key Deliverables
Tools and Libraries Used
pandas – Data manipulation, cleaning, feature engineering, and CSV handling
scikit-learn – PCA, StandardScaler, KMeans clustering, Logistic Regression classifier
matplotlib, seaborn – Visual exploration: histograms, heatmaps, boxplots, PCA plots
Streamlit – Interactive dashboard interface with filters, plots, and CSV export
VS Code Terminal – Running scripts, managing environments, debugging
RFM Segmentation: Incorporate Recency-Frequency-Monetary scoring for lifecycle marketing.
CLTV Prediction: Predict long-term customer value using XGBoost or deep learning.
Recommendation Systems: Suggest product bundles based on cluster behavior.
Automation: Add auto-retraining scripts using Airflow or CRON.
Personalized Reports: Export cluster-wise PDF summaries using pdfkit or reportlab.
Possible Next Steps & Conclusion
Conclusion
This project exemplifies the transition from raw data → segmented insights → actionable predictions. It mimics the exact steps followed in enterprise CRM and campaign analytics workflows.
By combining unsupervised and supervised learning with powerful visuals, it delivers:
Deep behavioral understanding
Real-time interactivity for marketers
Direct pathways to boost revenue through smarter targeting
As AI becomes more embedded in business intelligence tools, this solution stands as a modular, explainable, and production-ready asset for real-world deployment in any customer-facing domain.
Dive into the foundational concepts, algorithms, and real-world relevance behind this project. From machine learning principles to business strategy insights, this conceptual study bridges the gap between technical implementation and applied decision-making—helping you understand not just how it works, but why it matters.
Key Concepts
GitHub Repository
Want to dive deeper into how this project actually works?
We’ve made the complete codebase and resources available for you on GitHub
👉 Access the full repository here:
Whether you're a learner, recruiter, or collaborator — there's something for everyone.
Connect
Join us in shaping the future of leadership.
Innovate
contact@youlead.com
© 2025. All rights reserved.